Monitoring the VMware Event Broker Appliance with vRealize Operations Manager
, plus it's Kubernetes components like the Control Plane (Master), the Node(s) as well as the Pods by using vRealize Operations Manager.")
Since the VMware Event Broker Appliance (VEBA) is reaching more and more folks out there and the interest is growing steadily, it is important to validate the integration with other solutions (preferably VMware). At least that’s what I thought 😉.
Monitoring in terms of utilization and performance captured my interest. So, how can I monitor not only the appliance (virtual machine) but also the Kubernetes components like the Control Plane (Master), the Node(s) as well as the Pods? Furthermore, not only the workload is of interest but also the dependencies of the individual components to each other are interesting. Beyond that and because I’m just getting started, I would also like to have the ability to generate alarms if a desired state is no longer fulfilled.
VMware’s vRealize Operations Manager (vROps) and it’s Management Pack for Container Monitoring helped me quickly with my needs. Let me demonstrate you how we can prepare VEBA to send the desired data (metrics) to vROPs and how we import a custom dashboard that provides you with plenty of interesting and useful information.
Leveraging Google cAdvisor
Repository: https://github.com/google/cadvisor
cAdvisor (Container Advisor) will be the component which we will make use of to get resource usage and performance data provided for vROps. It is super easy to deploy and you will see first results quickly. Let me show you how.
I’m going to start an nginx container from which we will grab the data from after deploying cAdvisor.
docker run --name vmware-nginx -p 8181:80 vmwarecna/nginxThe nginx webserver container is running and listening on port 8181 for HTTP requests. Now let’s deploy cAdvisor in it’s latest version also as a docker container (for now).
Export the desired version as an environment variable. We will use this variable ($VERSION) for the container deployment.
VERSION=v0.35.0The following shows how the container deployment looks like and important for this example is the usage of the docker option --publish=8080:8080 which will expose the port through which we can reach the cAdvisor website.
sudo docker run \
  --volume=/:/rootfs:ro \
  --volume=/var/run:/var/run:ro \
  --volume=/sys:/sys:ro \
  --volume=/var/lib/docker/:/var/lib/docker:ro \
  --volume=/dev/disk/:/dev/disk:ro \
  --publish=8080:8080 \
  --detach=true \
  --name=cadvisor \
  gcr.io/google-containers/cadvisor:$VERSION
docker ps will show us if both containers are up and running as well as if they are listening on the specified ports:
CONTAINER ID        IMAGE                                       COMMAND                  CREATED             STATUS                      PORTS                           NAMES
ff0d3fad427d        gcr.io/google-containers/cadvisor:v0.35.0   "/usr/bin/cadvisor -…"   3 minutes ago       Up 3 minutes (healthy)      0.0.0.0:8080->8080/tcp          cadvisor
48da3118416f        vmwarecna/nginx                             "nginx -g 'daemon of…"   6 minutes ago       Up 6 minutes                443/tcp, 0.0.0.0:8181->80/tcp   vmware-nginx
Both are up and we will reach the cAdvisor page via localhost:8080. Navigate to the container, in my case the nginx webserver, which performance data we want to see. Here we go:
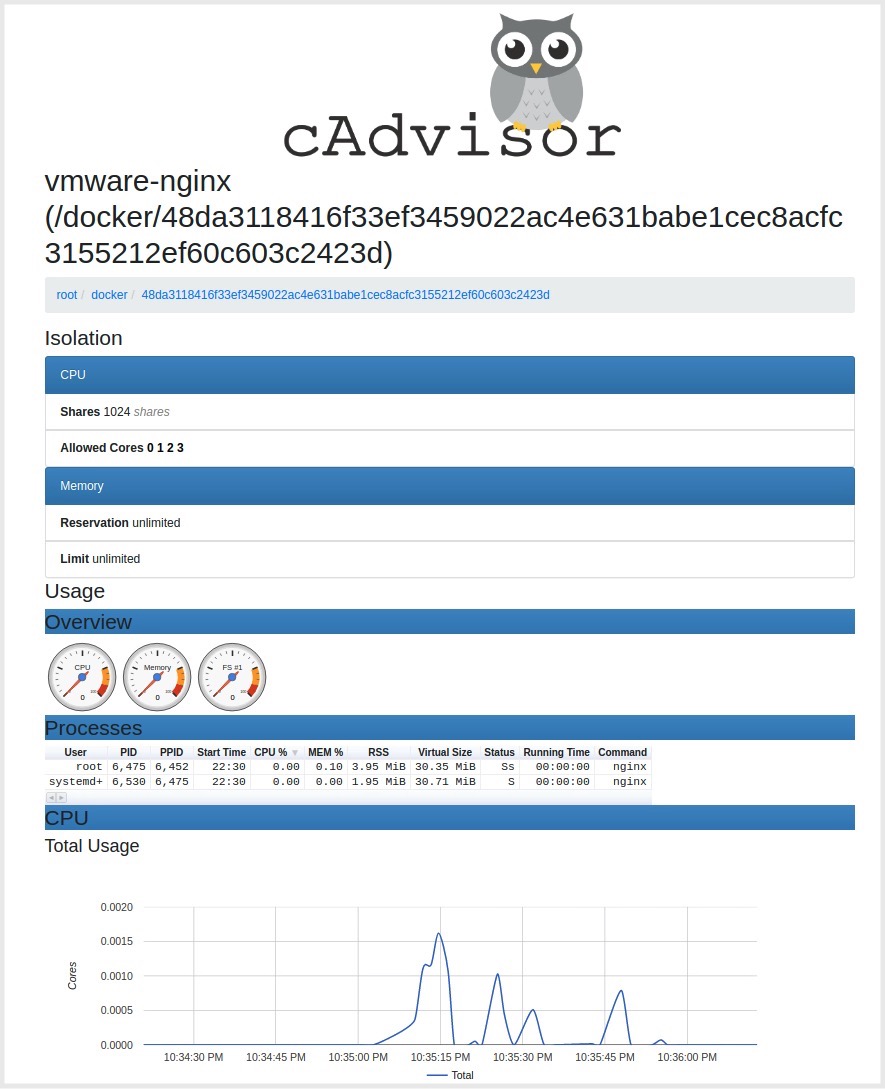
This is the kind of data that vROps can put into a good looking shape. Now let’s move on to deploy cAdvisor on VEBA.
Start the sshd daemon on VEBA
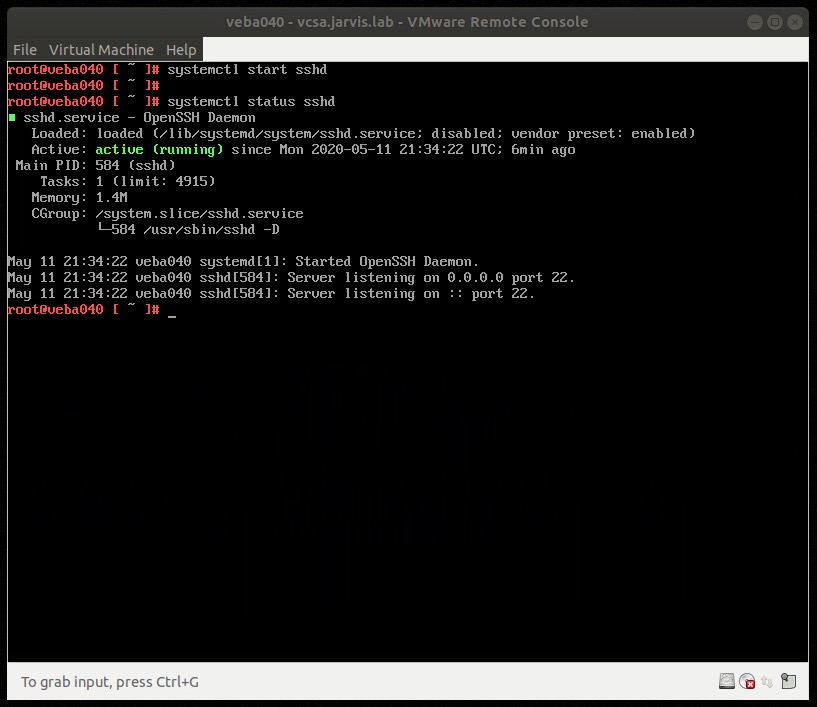
To deploy cAdvisor on VEBA, we have to establish a ssh connection to it because we will run the deployment steps directly from within the appliance. The sshd daemon is stopped by default. To start it, open a virtual machine console session (Web or VMware Remote Console) through the vSphere Client and login with your configured root credentials. Start the sshd daemon by executing systemctl start sshd and validate if it’s running properly with systemctl status sshd.
Deploy the cAdvisor as a Kubernetes DaemonSet
Environment with internet access
Now it’s time to deploy the cAdvisor as a Kubernetes DaemonSet onto VEBA. I’ve used the yaml specifications from the cAdvisor repository which are located in /deploy/kubernetes/base and modified them a bit for my needs. We will have three files at the end, because we are using kustomize in order to create and deploy the namespace and the daemonset for cAdvisor.
Establish a ssh connection to your VEBA appliance and change into the /tmp directory. I have set up a repository on Github where I’ve stored the necessary files for the deployment. From here (/tmp) we will clone the repository and deploy the daemonset to the Kubernetes Master subsequently. Run git clone https://github.com/rguske/monitoring-veba.git && kubectl apply -k monitoring-veba/.
Environment without internet access
For air-gapped environments, three simple steps are neccessary:
- create a new directory in
/tmp-> e.g.mkdir /tmp/monitoring-veba - create the following three specification files inside the newly created directory:
vim kustomization.yaml
apiVersion: kustomize.config.k8s.io/v1beta1
kind: Kustomization
namespace: vrops
commonLabels:
  app: vrops-cadvisor
resources:
- daemonset.yaml
- namespace.yaml
vim namespace.yaml
apiVersion: v1
kind: Namespace
metadata:
  name: vrops
vim daemonset.yaml
apiVersion: apps/v1
kind: DaemonSet
metadata:
  name: cadvisor
  namespace: vrops
spec:
  selector:
    matchLabels:
      name: cadvisor
  template:
    metadata:
      labels:
        name: cadvisor
    spec:
      containers:
      - name: cadvisor
        image: k8s.gcr.io/cadvisor:v0.35.0
        resources:
          requests:
            memory: 200Mi
            cpu: 150m
          limits:
            memory: 2000Mi
            cpu: 300m
        volumeMounts:
        - name: rootfs
          mountPath: /rootfs
          readOnly: true
        - name: var-run
          mountPath: /var/run
          readOnly: true
        - name: sys
          mountPath: /sys
          readOnly: true
        - name: docker
          mountPath: /var/lib/docker
          readOnly: true
        - name: disk
          mountPath: /dev/disk
          readOnly: true
        ports:
          - name: http
            containerPort: 31194
            hostPort: 31194
            protocol: TCP
        securityContext:
            capabilities:
              drop:
              - ALL
              add:
              - NET_BIND_SERVICE
        args:
         - --port=31194
         - --profiling
         - --housekeeping_interval=1s
      automountServiceAccountToken: false
      terminationGracePeriodSeconds: 30
      volumes:
      - name: rootfs
        hostPath:
          path: /
      - name: var-run
        hostPath:
          path: /var/run
      - name: sys
        hostPath:
          path: /sys
      - name: docker
        hostPath:
          path: /var/lib/docker
      - name: disk
        hostPath:
path: /dev/disk- By executing
kubectl apply -k .from within the new folder (/tmp/monitoring-veba), the daemonset will be deployed in a new namespace calledvrops.
Validate the cAdvisor deployment
To ensure that our procedure was correct, we will check the deployment of the pod.
root@veba040 [ /tmp/monitoring-veba ]# kubectl -n vrops get pods
NAME             READY   STATUS    RESTARTS   AGE
cadvisor-ccgcx   1/1     Running   0          4m
STATUS Running is the desired state which will fulfill our requirements to continue with the import of the vROps Management Pack for Container Monitoring as well as with the configuration of the Kubernetes Adapter which is available after a successful import.
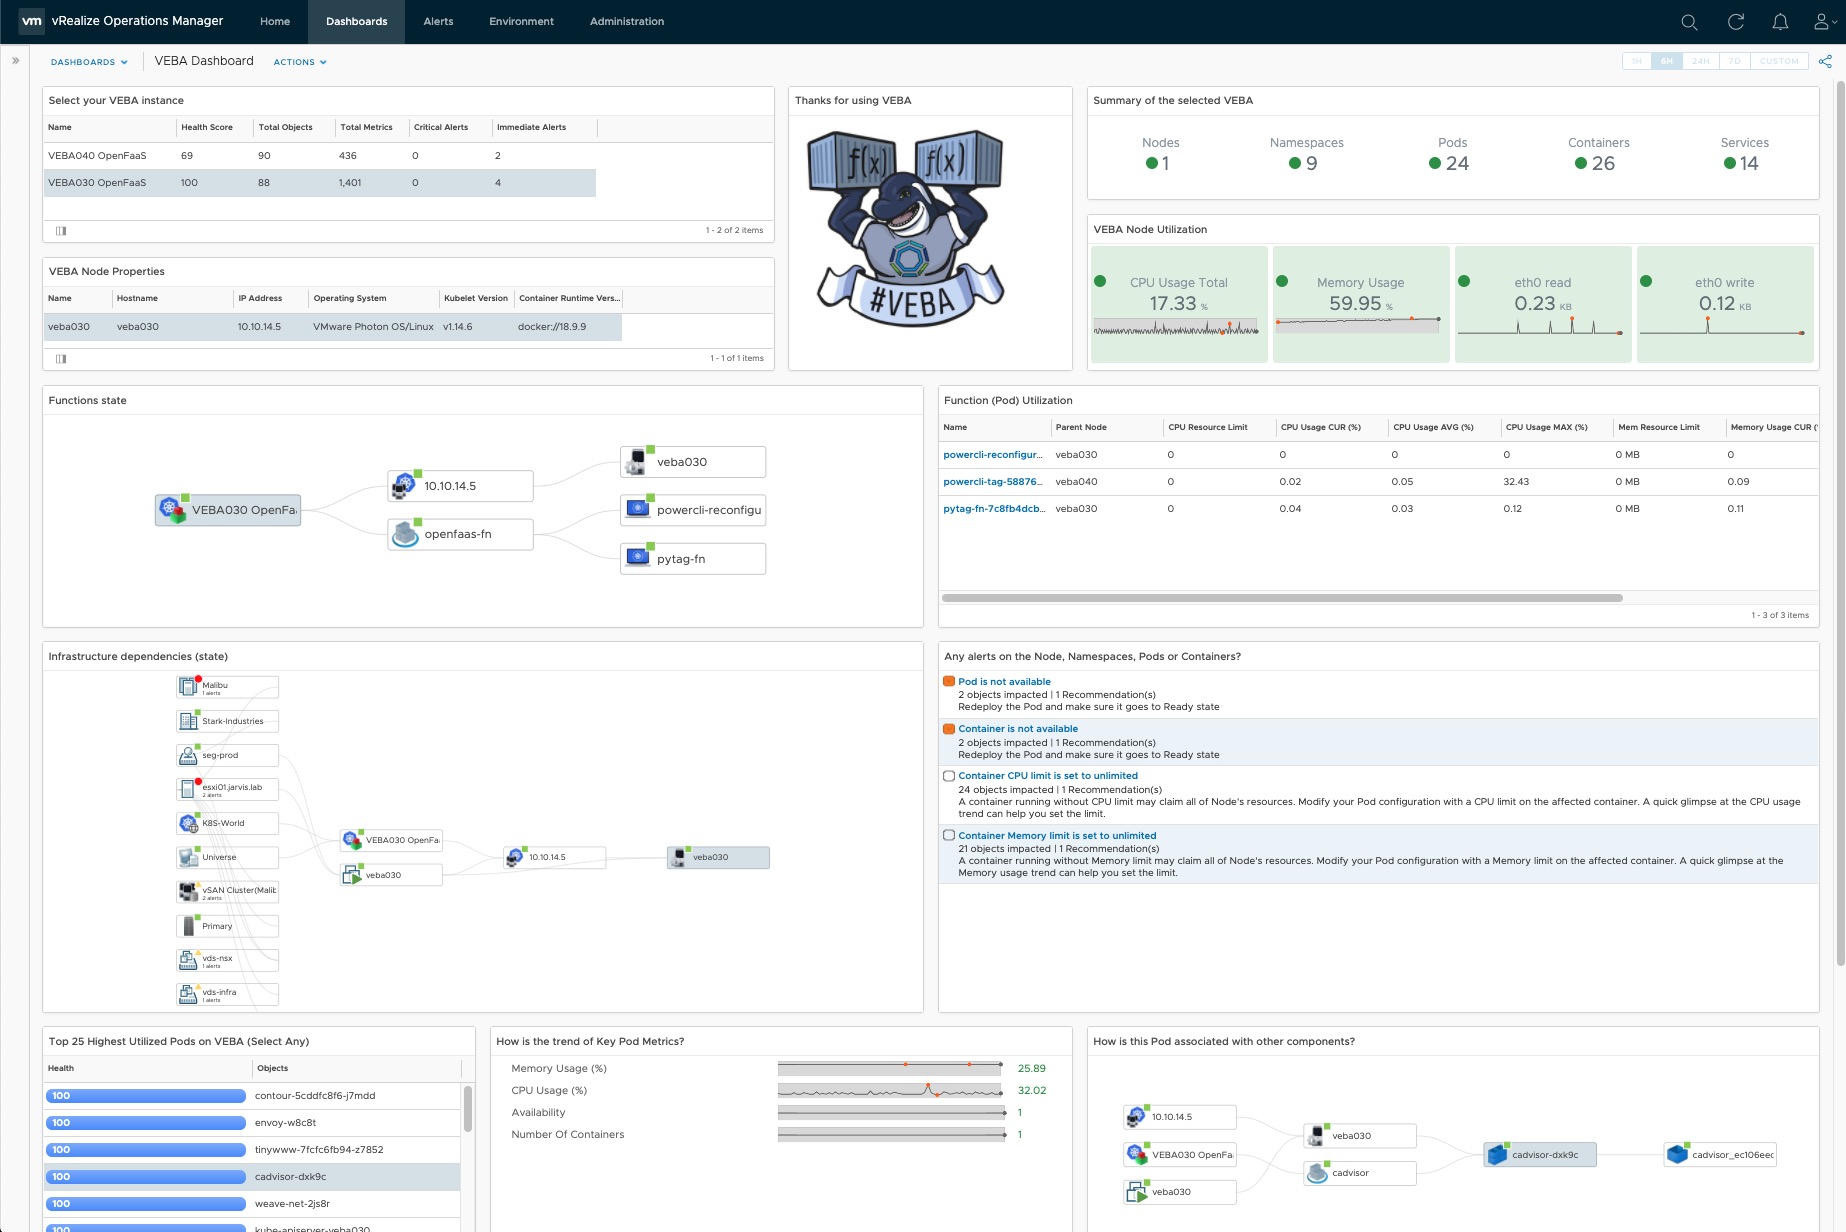
A Dashboard to monitor the VMware Event Broker Appliance
Before we continue with the configuration steps in vRealize Operations Manager, I wanted to give you a little sneak peek what you can expect by the end.
Step 1. Import vROps Management Pack for Container Monitoring
To enable the capability to monitor Kubernetes Clusters in vRealize Operations Manager, it’s necessary to import a Management Pack for it, which is available for free at the VMware Marketplace.
- Download the Mangement Pack for Container Monitoring
- Import the Management Pack in vROps as follows:
- Go to
Administration->Repositoryand selectADD/UPGRADE - Browse to the folder which contains the
vmware-MPforContainerMonitoring-1.4.3-15987816.pakfile for the Management Pack and upload it up to vROps- It will appear after the installation
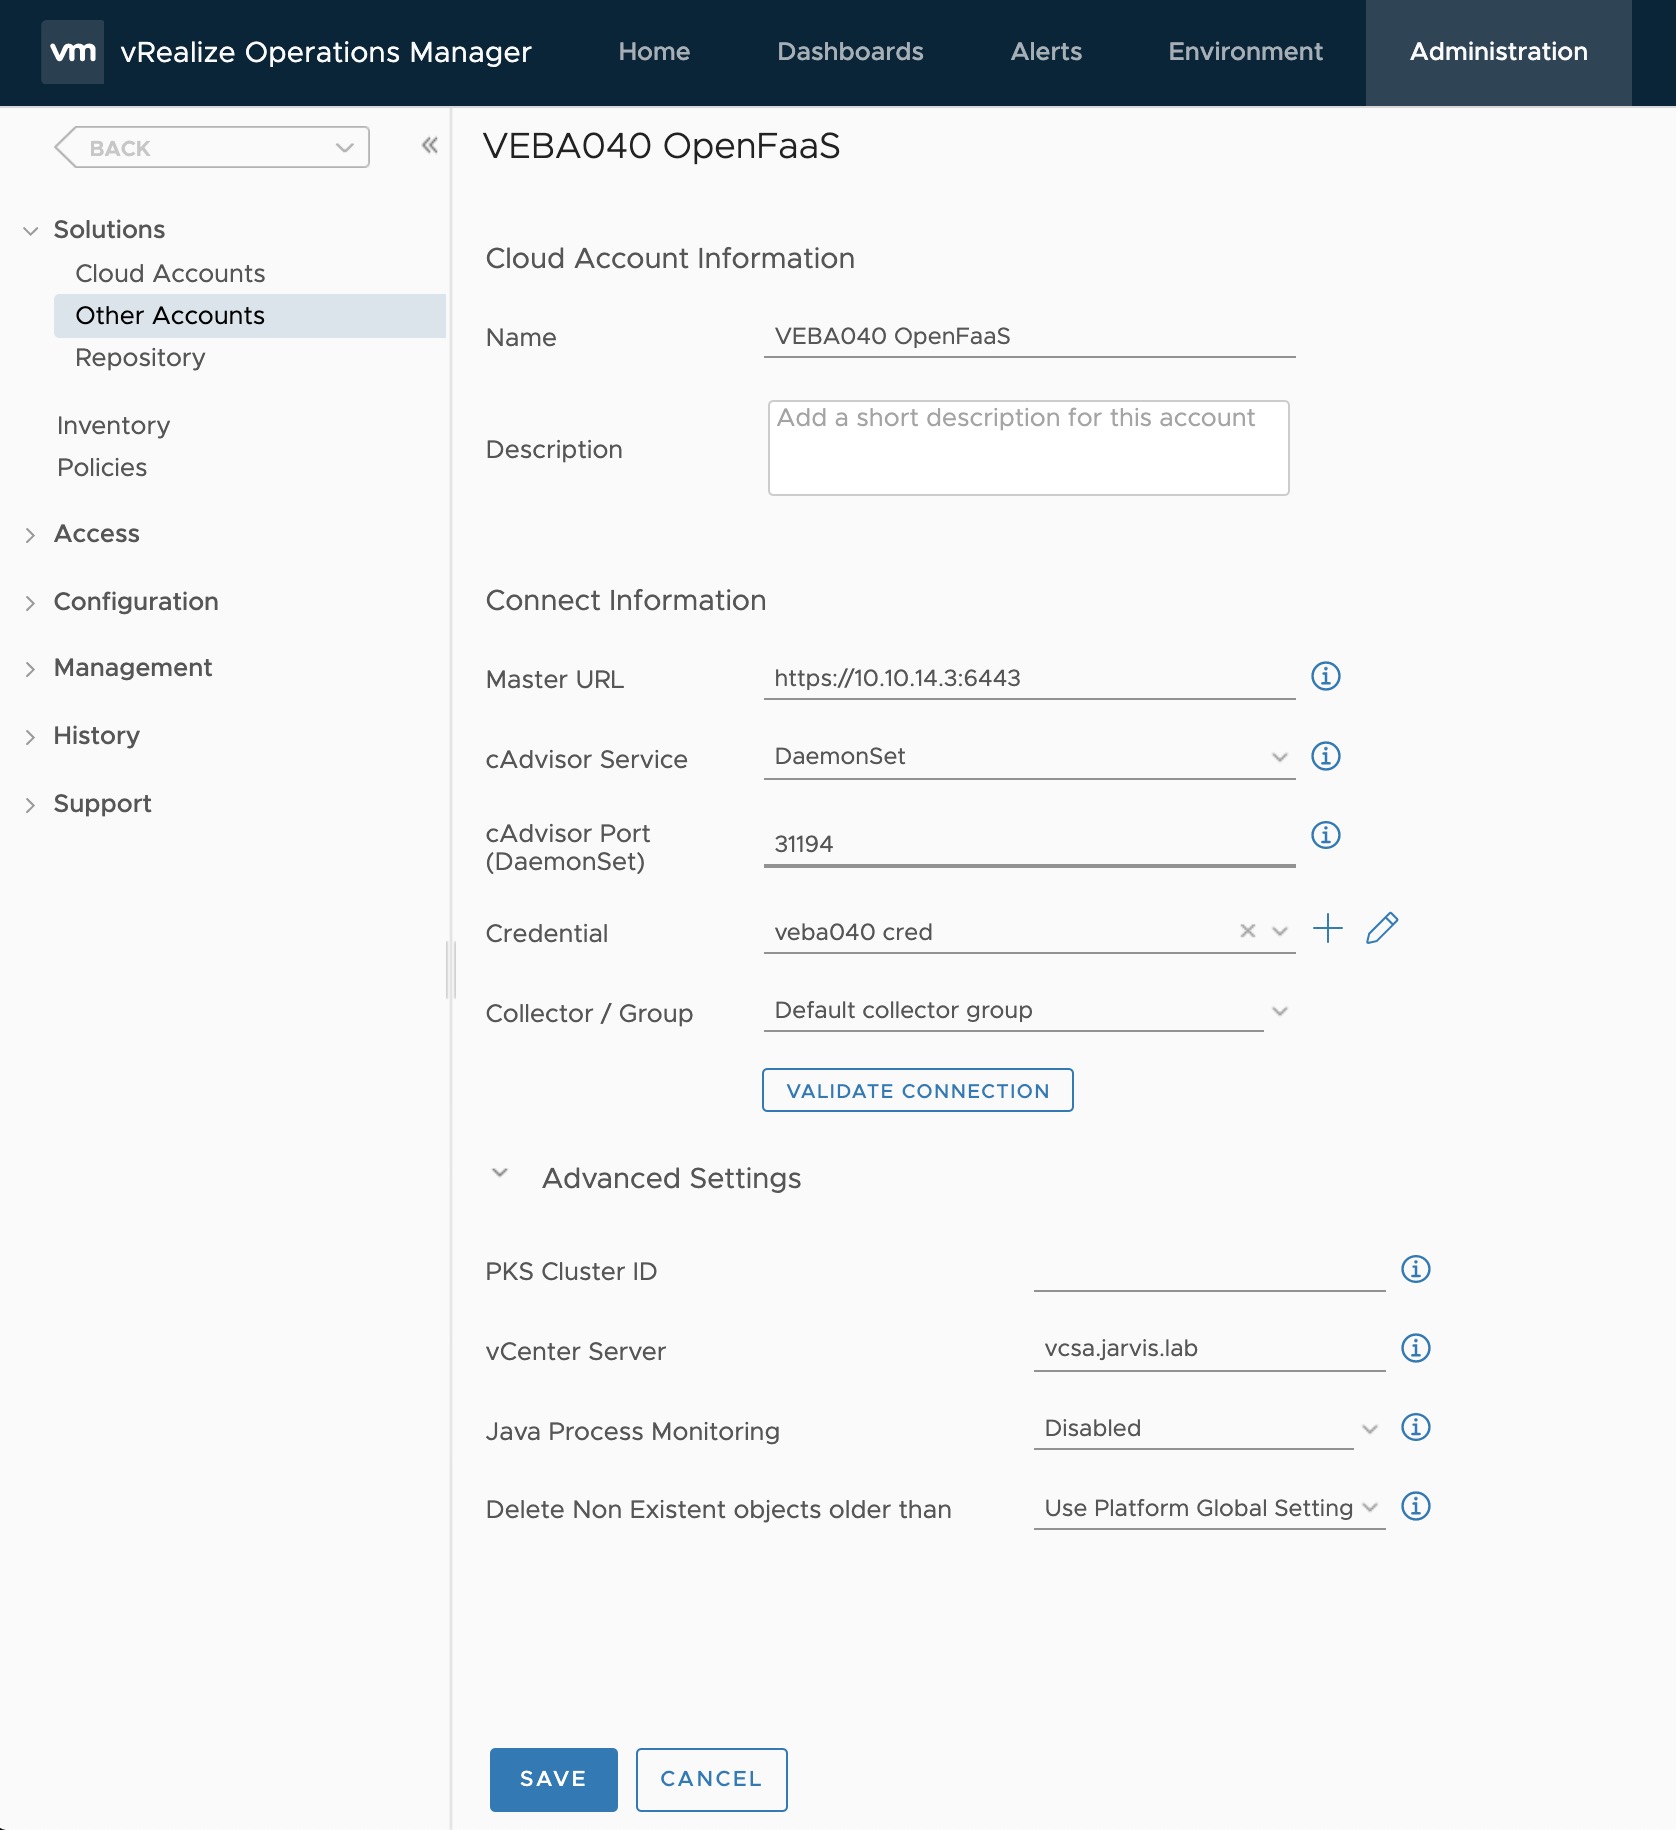
- Configure the Kubernetes Adapter to establish a connection to your VEBA node(s)
- Go to
Other Accountsand select theKubernetes Adapter- Enter the IP address of your VEBA instance followed by port 6443
- e.g.
https://10.10.14.4:6443
- e.g.
- Select
DaemonSetas your cAdvisor Service - Enter your specified
cAdvisor Port31194was defined above
- Add new
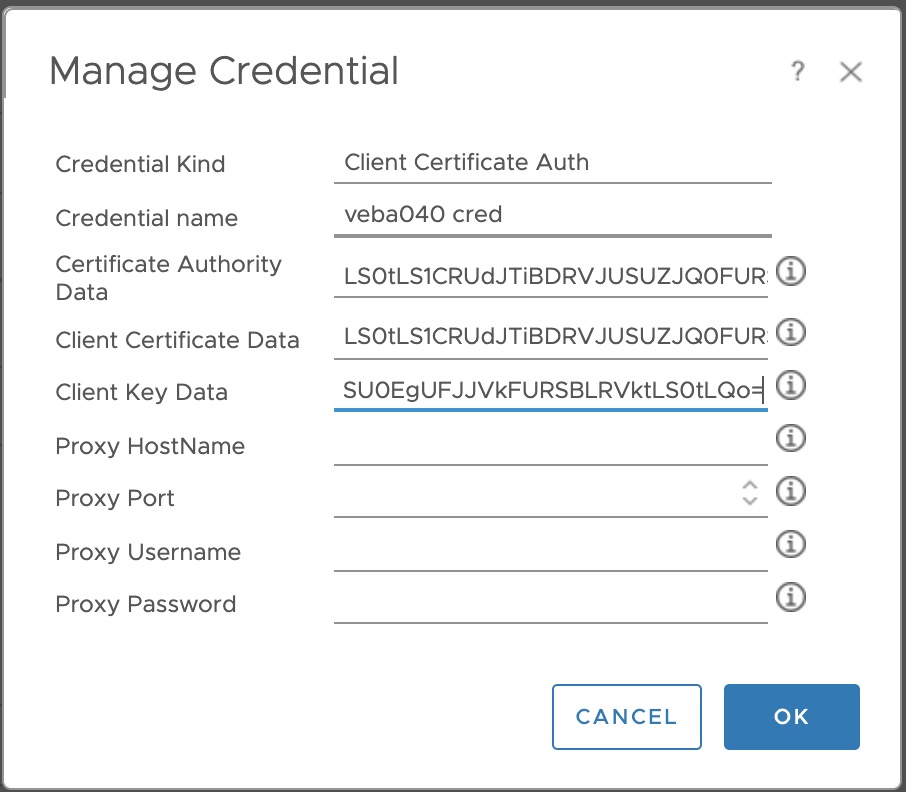
Credentialsfor your VEBA instance
- Enter the IP address of your VEBA instance followed by port 6443
We need to configure Client Certificate Auth as credential kind. To get the data for Certificate Authority Data, Client Certificate Data as well as for the Client Key Data we need to ssh again into our VEBA appliance. Execute the following to get the data:
grep 'client-certificate-data\|client-key-data\|certificate-authority-data' ~/.kube/configThis is how the output should look like:
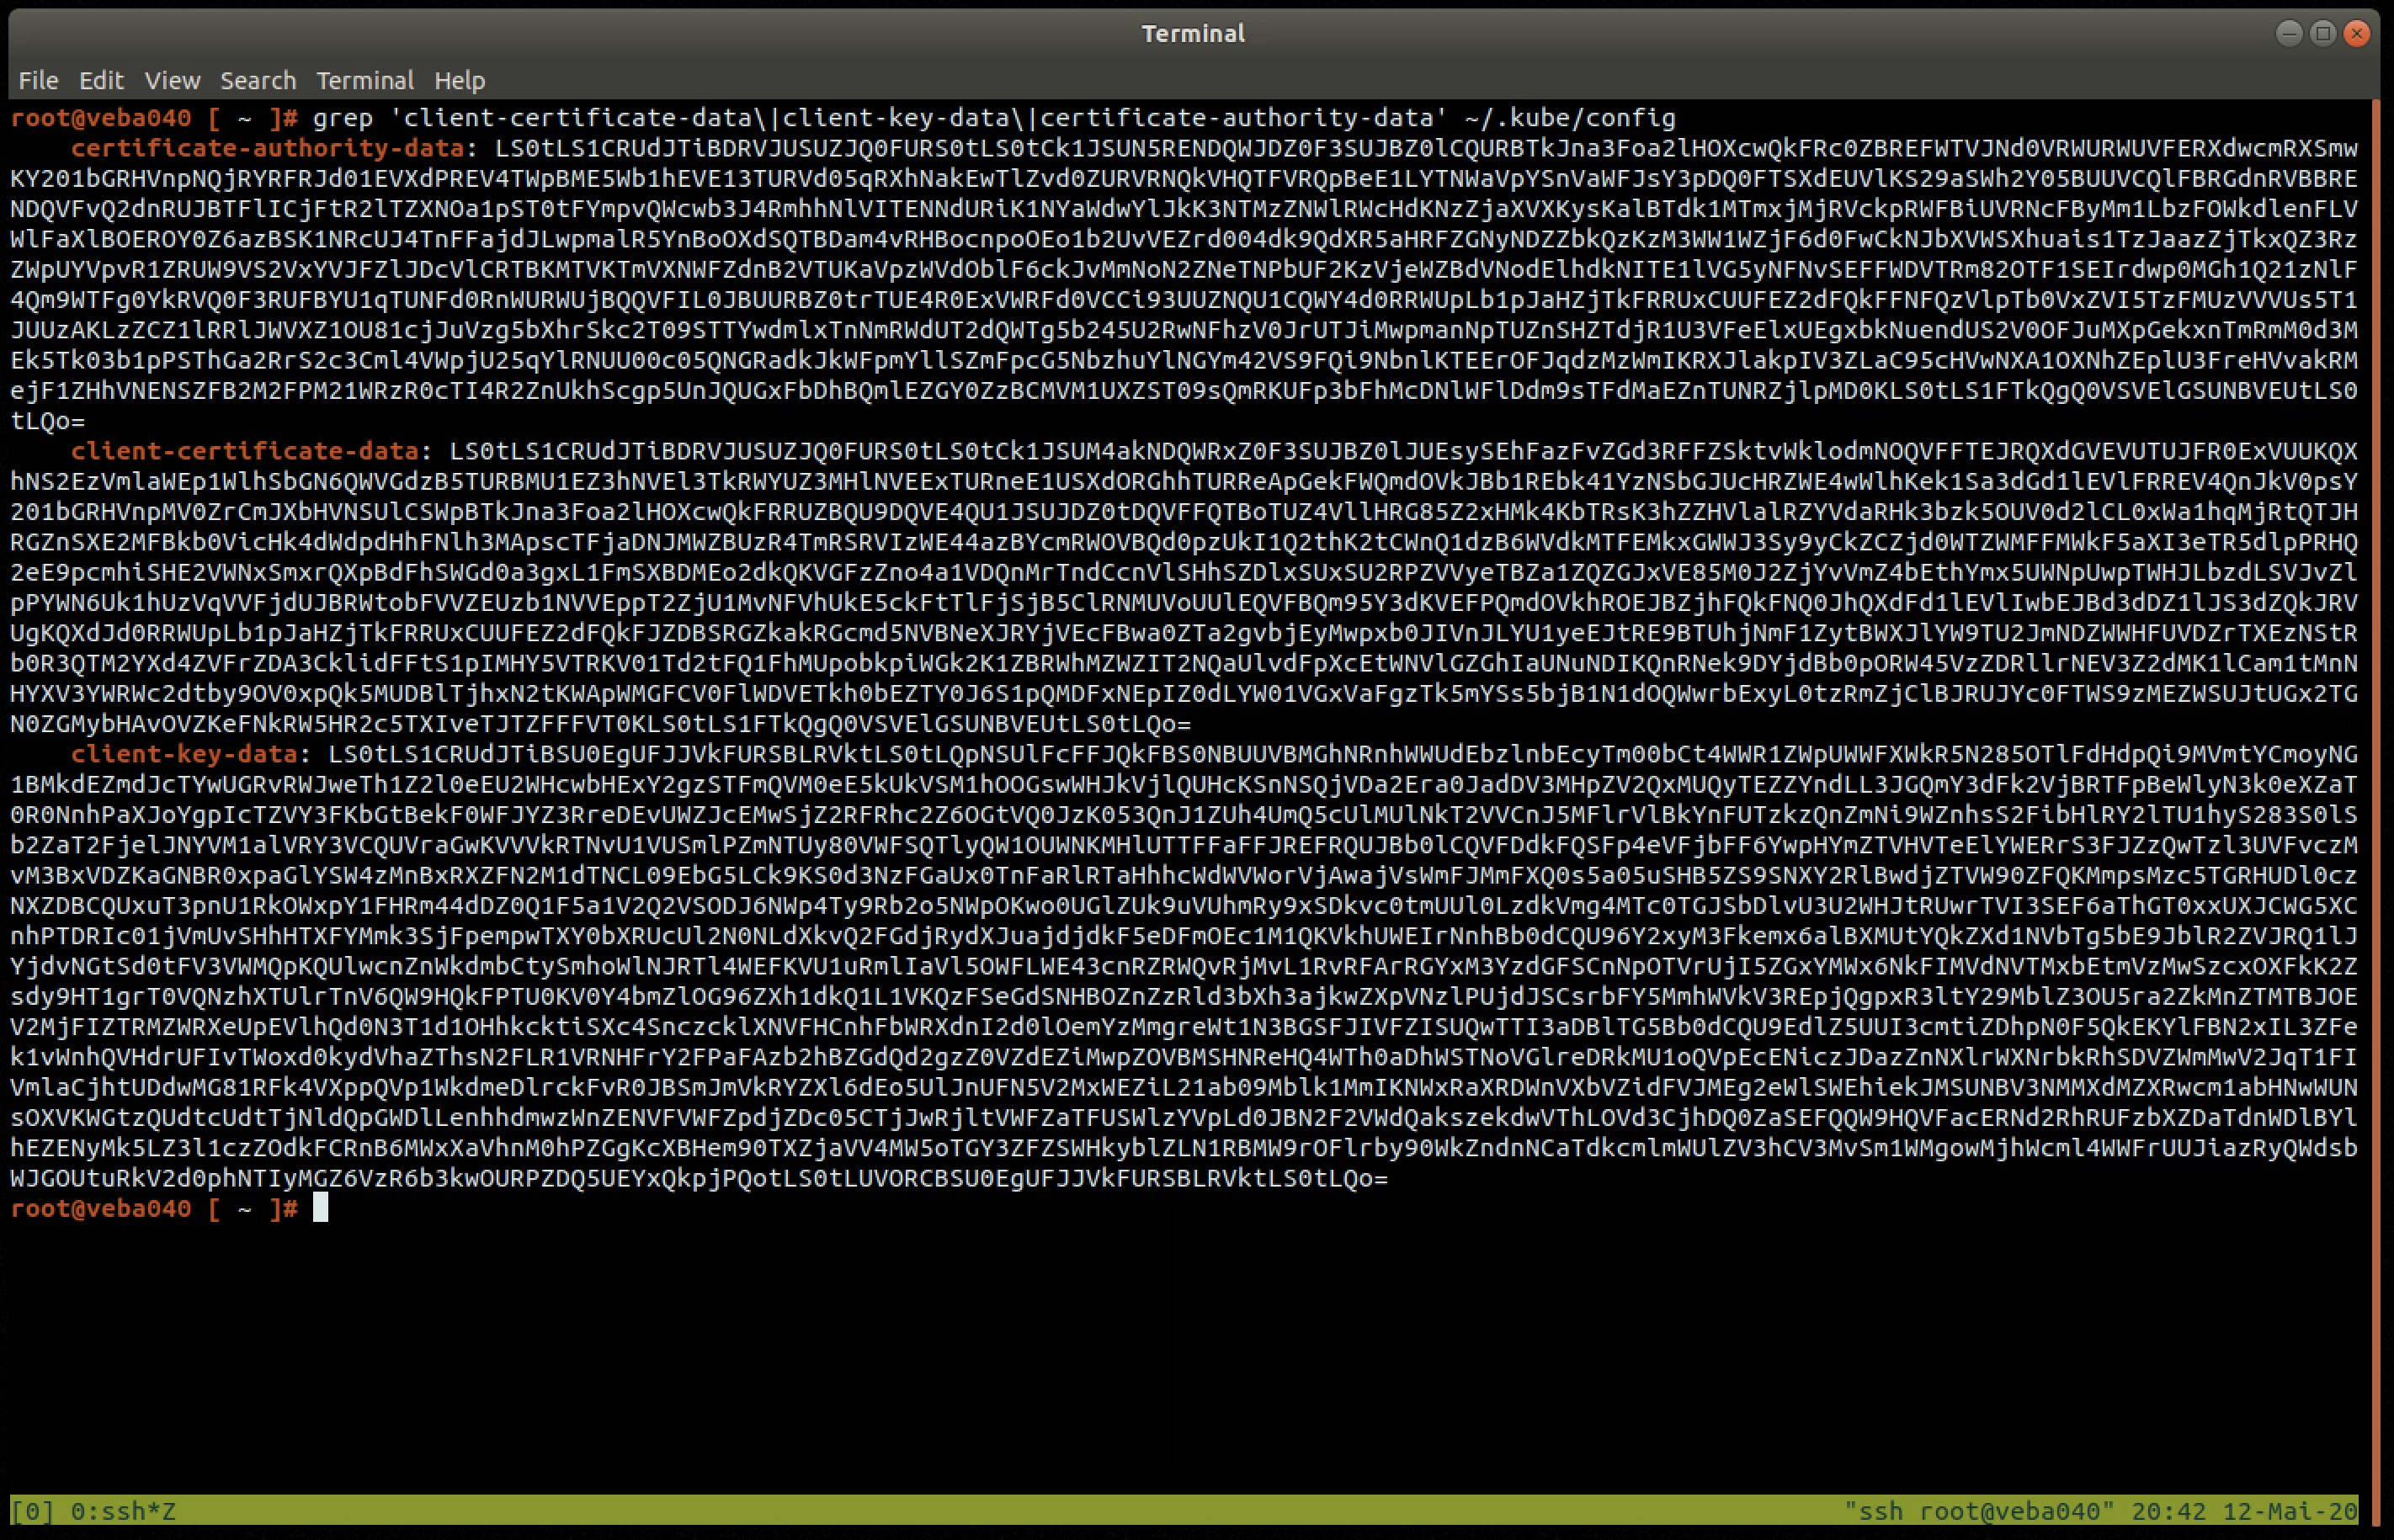
Back in vROps, fill out the blank fields as required (Proxy only if needed).
The last configuration at this point is to provide the FQDN of your vCenter Server under Advanced Settings. This will give us the possibility to include the virtual machine object itself and not only the Kubernetes components in the dashboard later on.
ssh again after finishing the above steps. systemctl stop sshdStep 2. Preparations for the dashboard
Before we can import the dashboard and the corresponding views, we need to configure two simple steps first. The creation of a Custom Metric Configuration and a Dynamic Custom Group.
VEBA Node Utilization Metric Configuration
Go to Administration -> Configuration -> Metric Configurations -> ReskndMetric and select ADD. Enter the name veba_node_utilization and paste the following configuration into the right opened field:
<?xml version="1.0" encoding="UTF-8"?>
<AdapterKinds>
    <AdapterKind adapterKindKey="KubernetesAdapter">
        <ResourceKind resourceKindKey="K8S-Minion">
            <Metric attrkey="Cpu|UsagePct|Total" label="CPU Usage Total" unit="%" yellow="80" orange="90" red="99" link=""/>
            <Metric attrkey="Memory|UsagePct" label="Memory Usage" unit="%" yellow="80" orange="90" red="99" link=""/>
            <Metric attrkey="Network|Interface:eth0|ReadMb" label="eth0 read" unit="KB" yellow="" orange="" red="" link=""/>
            <Metric attrkey="Network|Interface:eth0|WriteMb" label="eth0 write" unit="KB" yellow="" orange="" red="" link=""/>
        </ResourceKind>
    </AdapterKind>
</AdapterKinds>
VEBA openfaas-fn namespace Custom Group
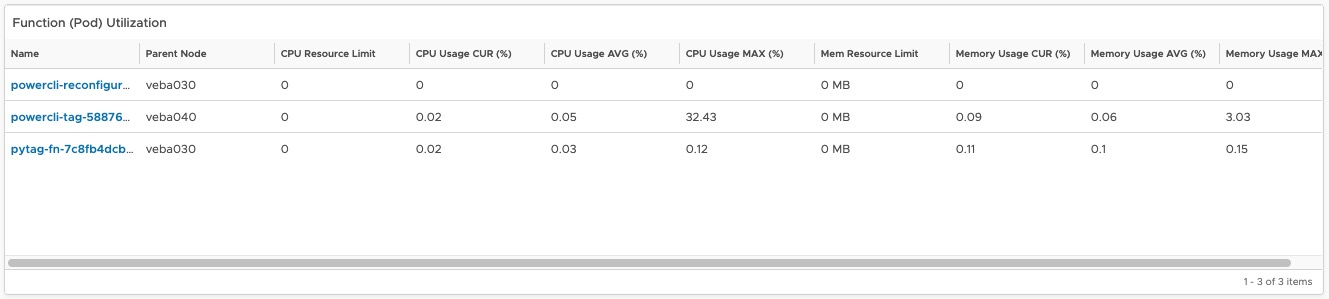
The dashboard includes a widget which will display all deployed functions and it’s utilization in terms of CPU and Memory (limit, current, average and maximum).
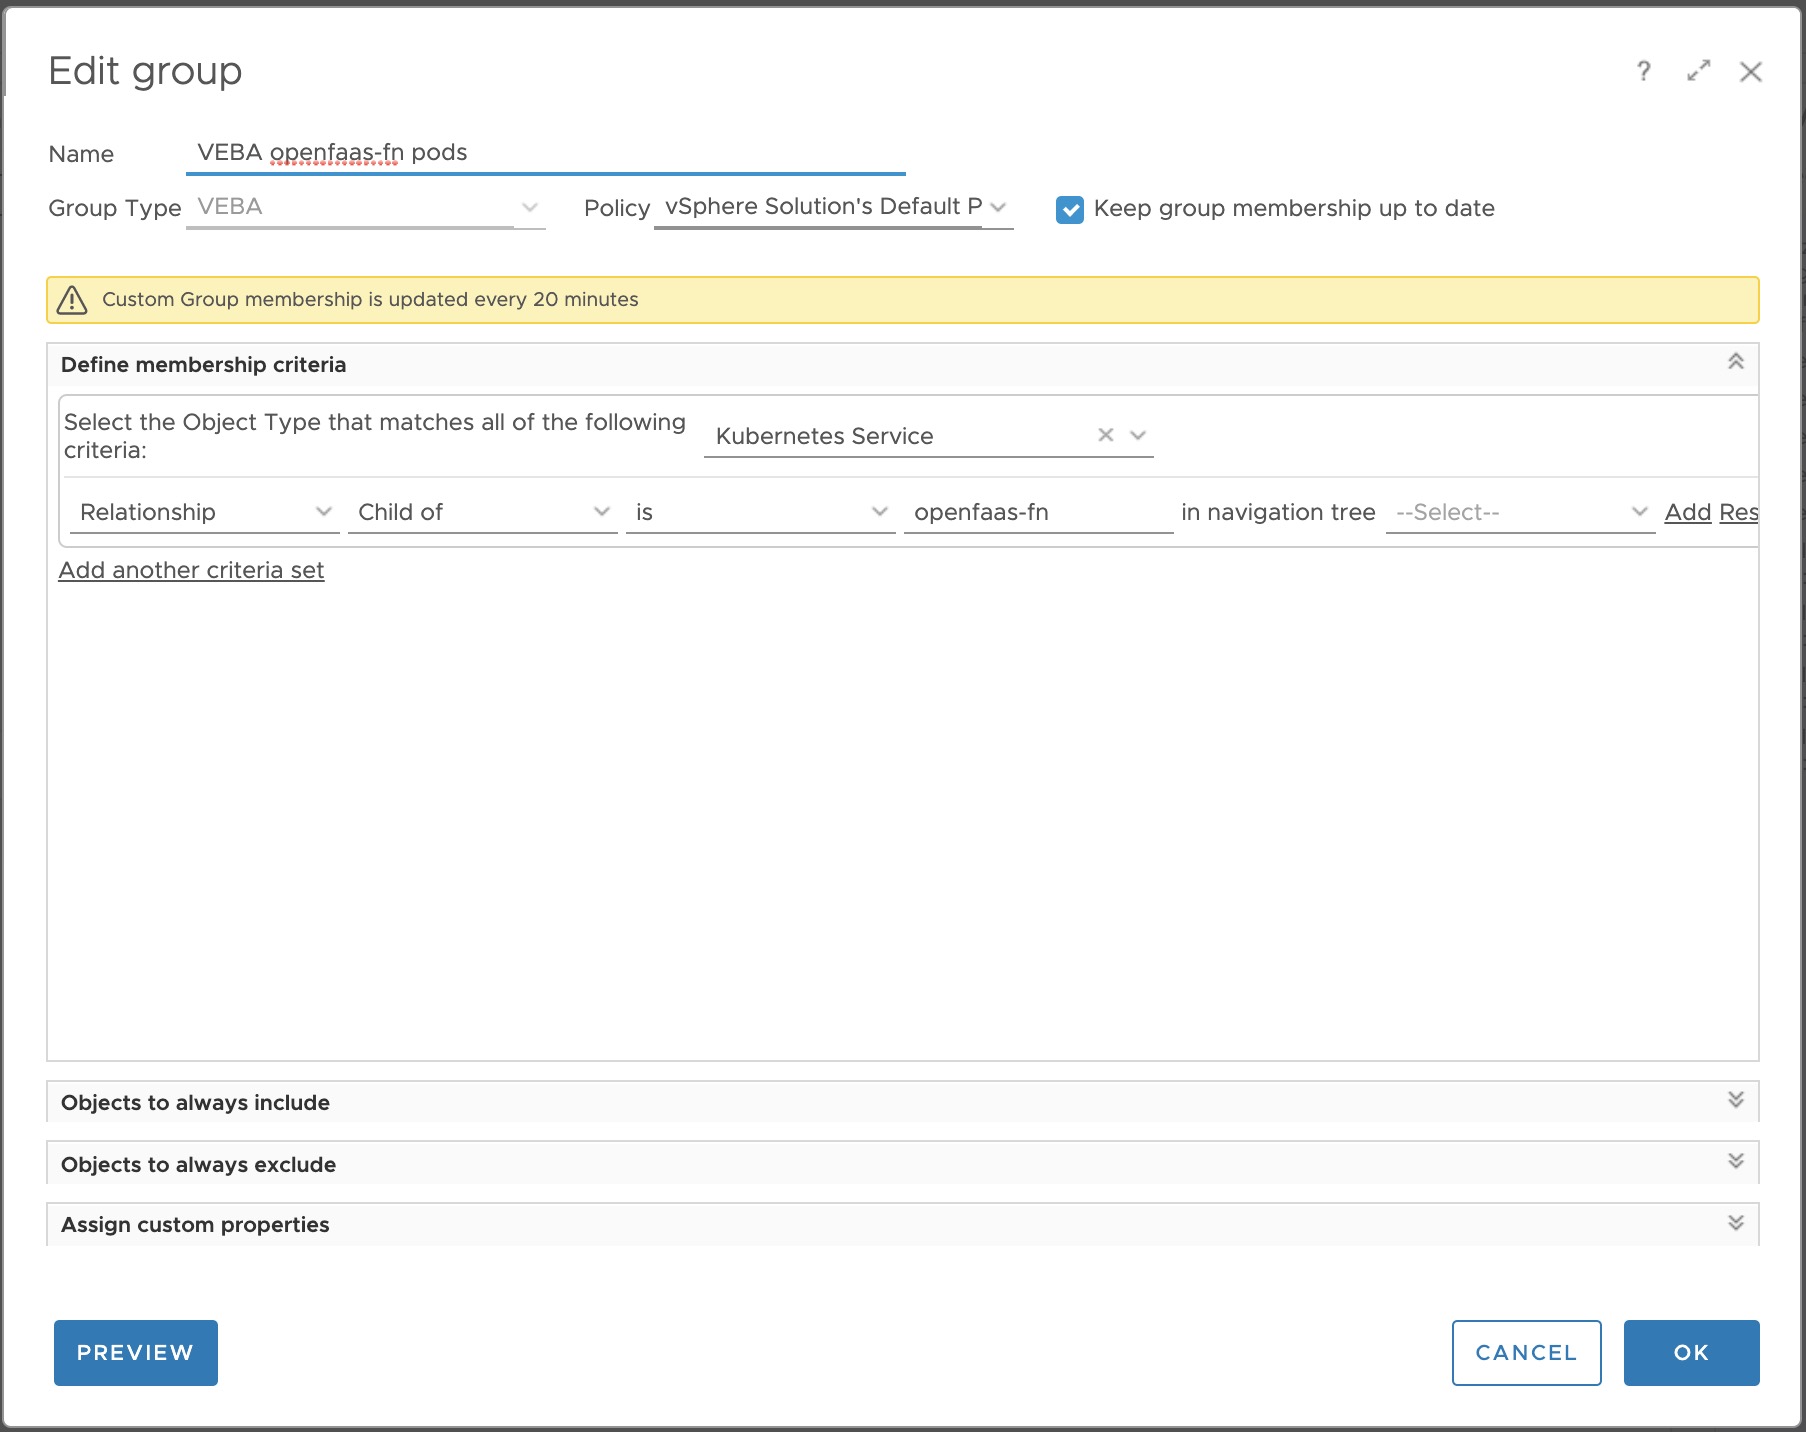
I configured a Dynamic Custom Group in vROps to realize this. Like the above step for the VEBA Node Utilization Metric Configuration, this Dynamic Custom Group has to be configured before we import the dashboard. Otherwise, the widget(s) will be empty.
Navigate to Administration -> Configuration -> and create a new Group Type called VEBA. The Custom Group can be configured under Environment -> Groups and Applications -> Custom Group. Select the before created Group Type VEBA and click ADD. Configure the Custom Group as shown in Figure VIII:
Step 3. Import the Dashboard and it’s Views
The Dashboard is available for download on VMware {code}
Unpack the zip file and import the views first. Dashboards -> select any of the views, click on ACTIONS and select Manage Views. The Import button will appear after clicking on the three points next to the ADD button. Go to the folder where you’ve unpacked the dashboard.zip and select the views.zip. This will import the Views.
Similar procedure applies for the dashboard itself. Dashboards -> ACTIONS -> Manage Dashboards -> three points -> Import and this time, select the dashboard.zip.
Here we go!