Monitoring Container VMs with vRealize Operations Manager
.")
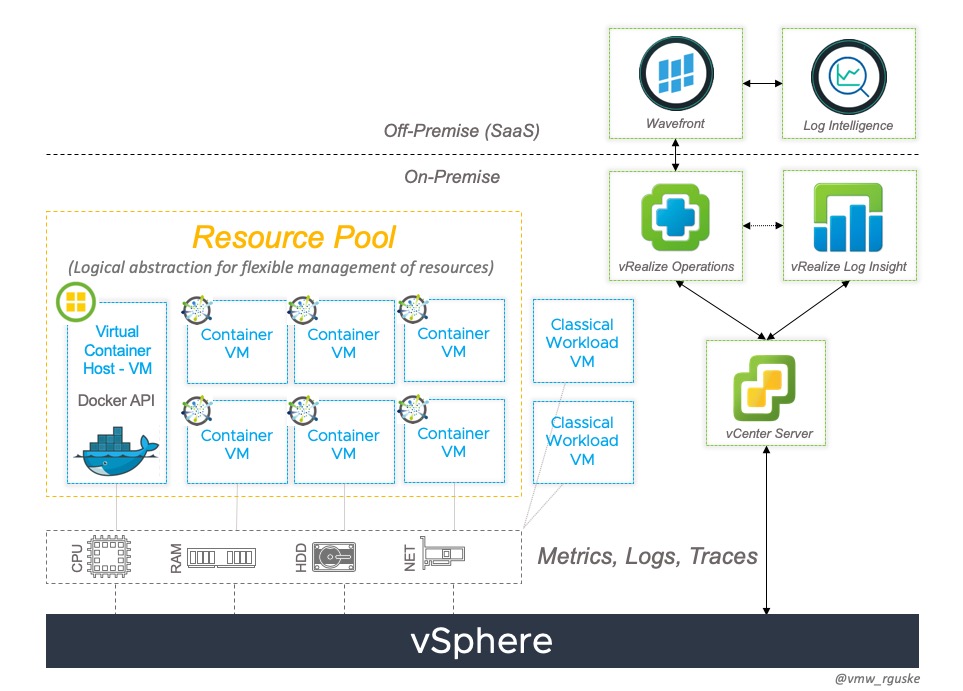
Based on talks with customers who already made their experiences running containerized applications in test as well as in production and who are using vSphere Integrated Containers for their way to go, I decided to build a dashboard to monitor those workloads (Container-VMs) with VMware´s Cloud Management Solution, vRealize Operations Manager (vR Ops).
The Dashboard
Treating Containers as “First-Class Citizens” is what vSphere Integrated Containers can offer to IT-(Dev)Ops Teams through instantiating a Container-Image as a Virtual Machine.
“Therefore you don´t have to build out a separate, tailored infrastructure stack and can continue to leverage existing Scalability, Security and Monitoring capabilities.”
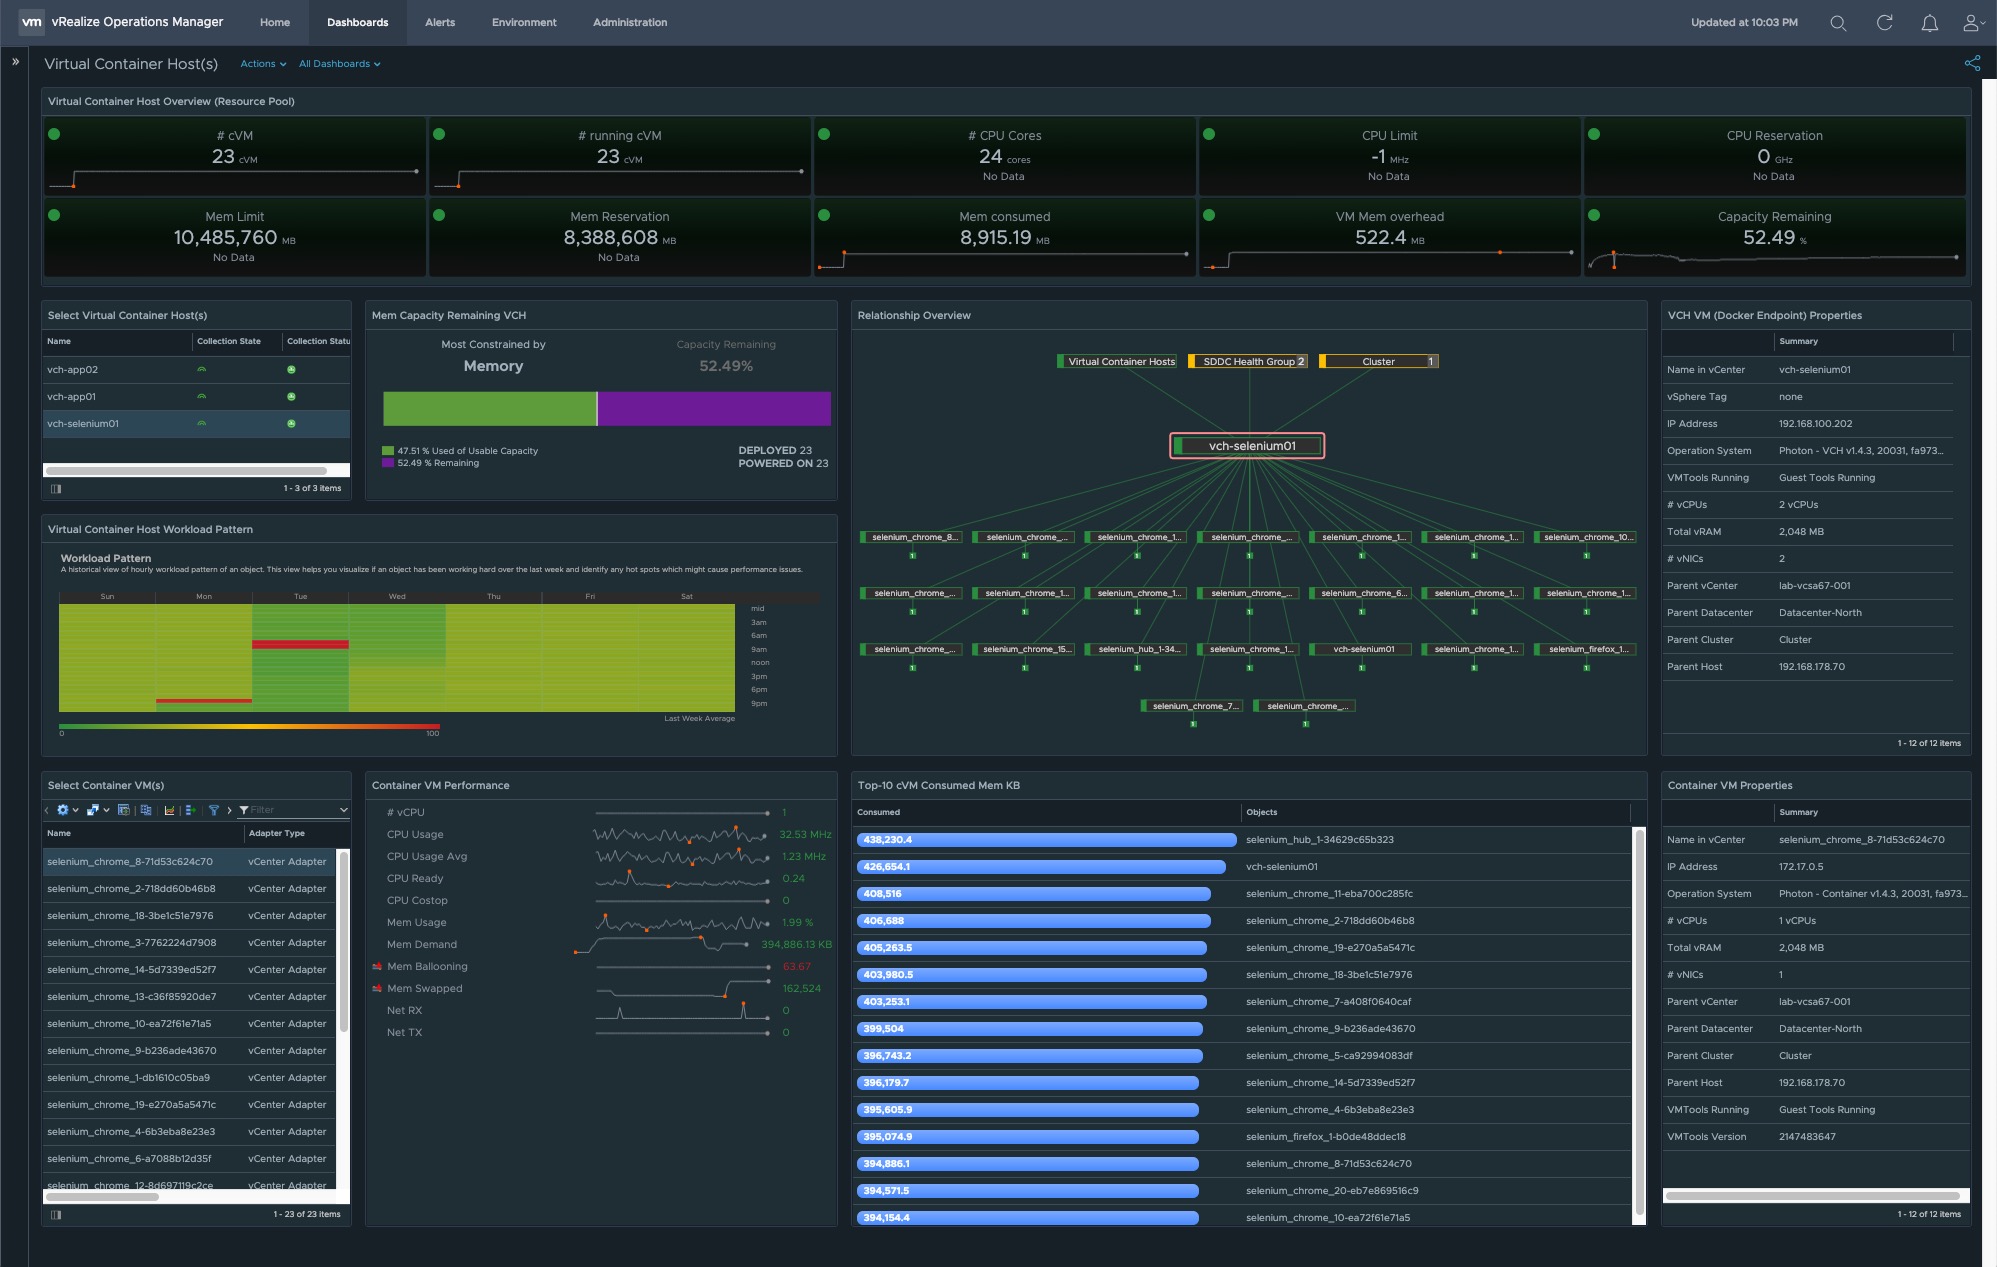
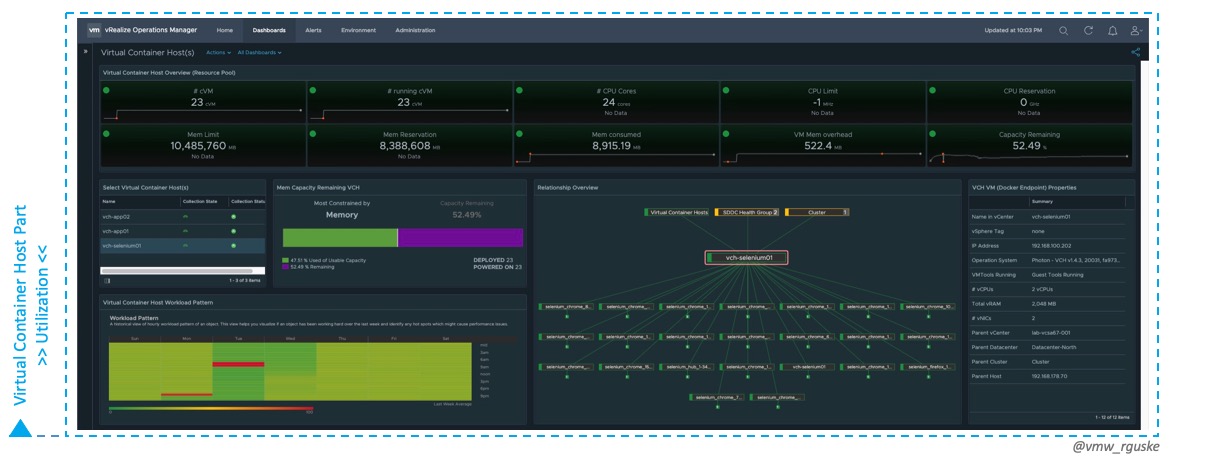
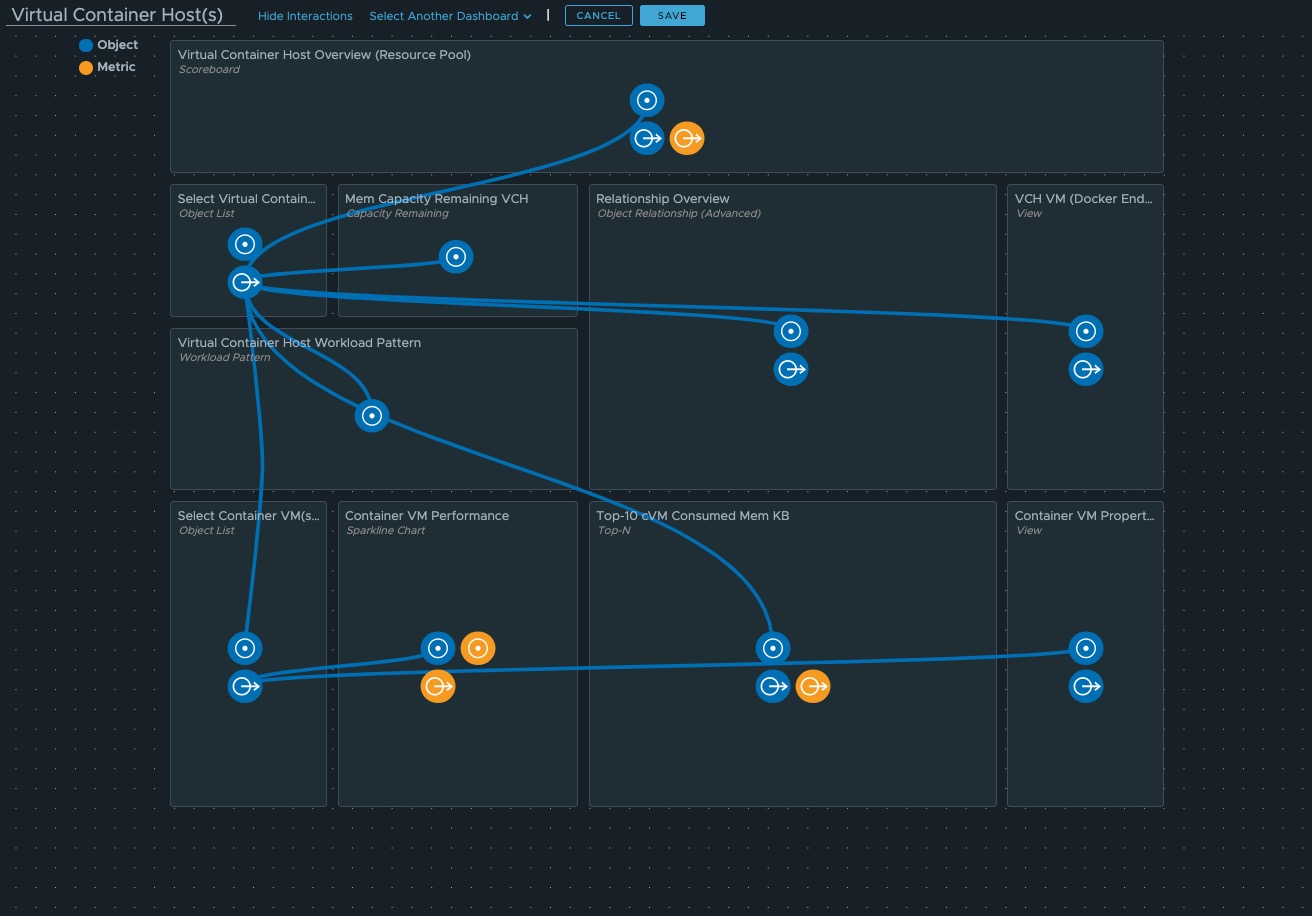
I´ve splitted the dashboard into two parts because I wanted to get as most as valuable content displayed on the screen without scrolloing down the page (depending on your resolution 😉). The upper part gives you more details about the utilization and properties of the Virtual Container Host itself. Thus resource pool as well as the Virtual Container Host VM (Docker endpoint) are covered by the upper part.
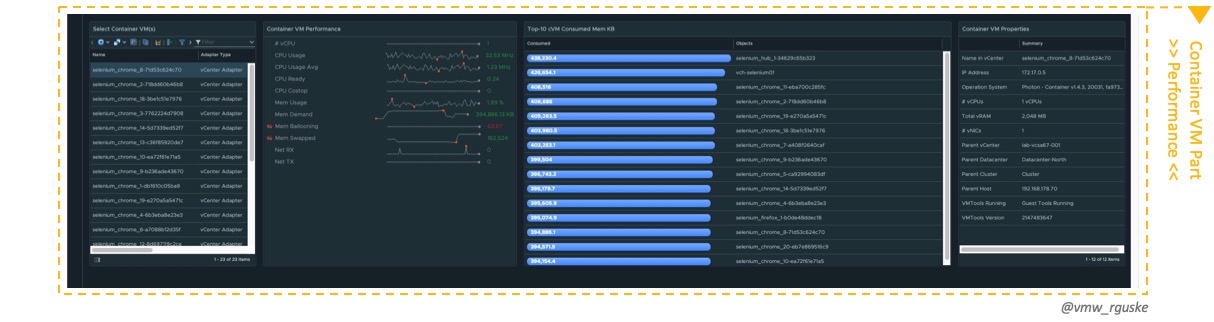
The lower part is focused on the performance of each Container-VM (by selecting the cVM) running inside the resource pool, and by the end of the day, on the service which will be provided by the container.
I also considered to build out each part in a separate dashboard, so one for the Virtual Container Host(s) and another one for the Container-VM(s), but nevertheless I decided to go with the “All-in-One” variant.
Download via VMware {code}
If you like the dashboard and you are interested to monitor your containerized applications in terms of performance and utilization, you can download it through the following link: https://code.vmware.com/samples?id=5283
But before you can make use of it you have to do some preperations first.
Things you have to do first before the import
In vSphere
- Create a new vSphere-Tag
Open up the vSphere-Client and create a new vSphere-Tag Category as well as a vSphere-Tag called Virtual Container Host and assign the Tag to every Virtual Container Host Resource Pool(!).
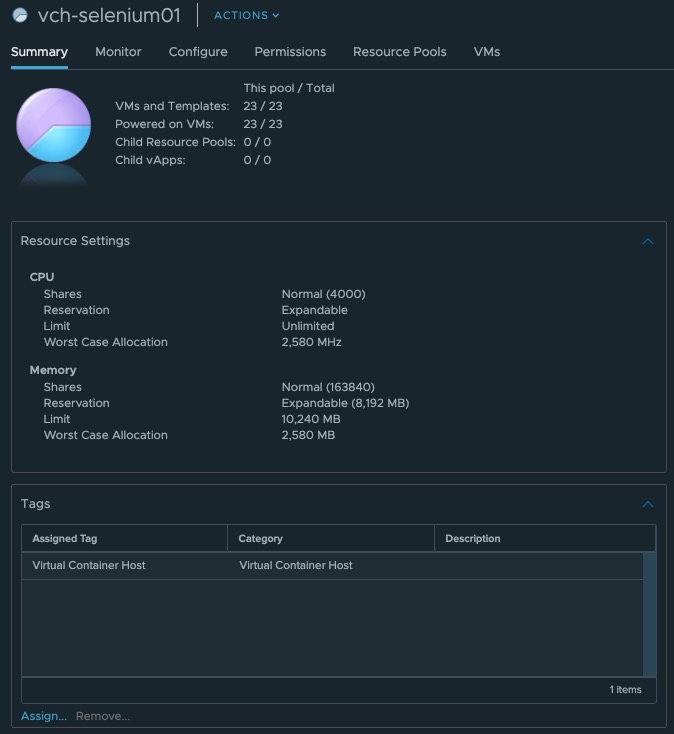
I´m going to explain the reason why we need this in a moment.
In vROps
- Create a Group Type to categorize objects in vR Ops.
- Create a Dynamic Custom Group for dynamic assignment of Virtual Container Hosts through a membership criteria.
- Create two new Metric Configurations to define a specific set of metrics for the VCH as well as for the cVM.
- Import two new Views (VCH properties & cVM properties)
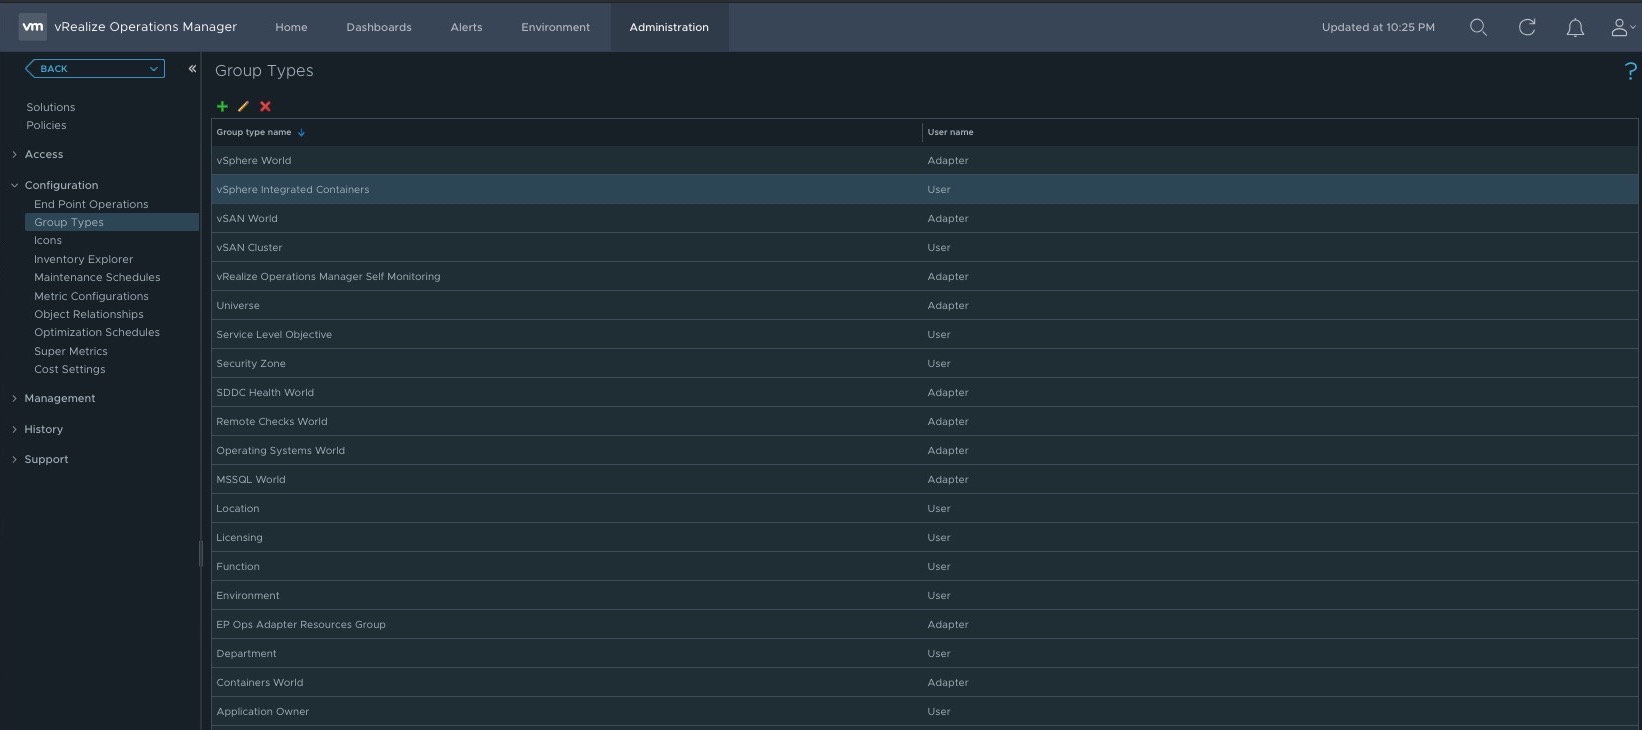
Let´s start with #1, the creation of a Group Type, a superior group for our Dynamic Custom Group which we´ll configure in step #2. When you´re already logged in into vR Ops go to Administration and select Group Types which is under Configuration on the left side. Create a new one and call it vSphere Integrated Containers for example.
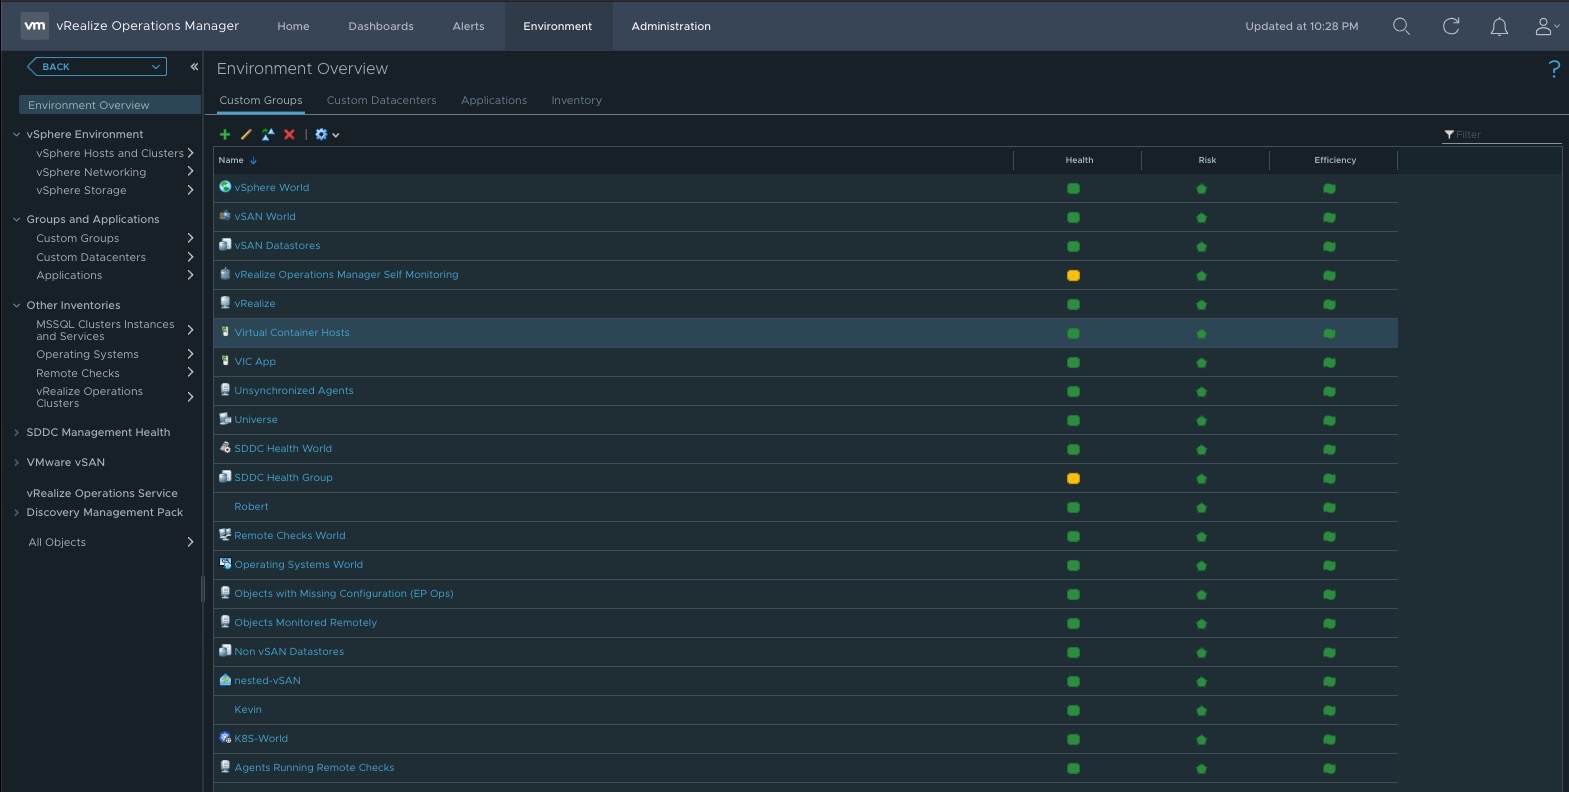
It is followed by the mentioned Dynamic Custom Group which is not found under Administration but under Environment and then Groups and Applications. Create a new one and call it e.g. Virtual Container Hosts.
One striking aspect about Dynamic Custom Groups is the fact that we can define the Membership based on a specific criteria. During my first tests, I´ve defined the membership based on the Prefix of a Virtual Container Host name like **vch-**app01 for example. Asking me naming conventions is an important topic and every organization has its own, so it won´t fit for everyone and therefore I had to find another criteria to let the dynamic assignment to this group happen.
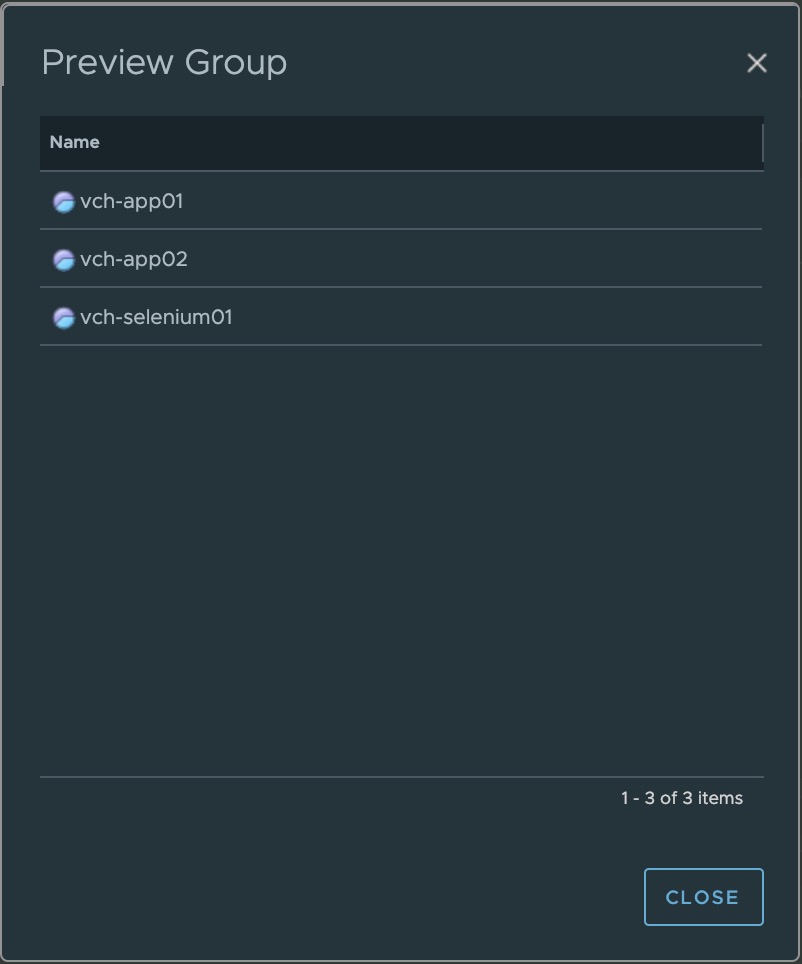
I thought vSphere-Tags is a perfect alternative as a criteria. Consequently, we have to configure it for the Object Type Resource Pool like the screenshot below shows.
Properties –> Summary|vSphere Tag is Virtual Container Host
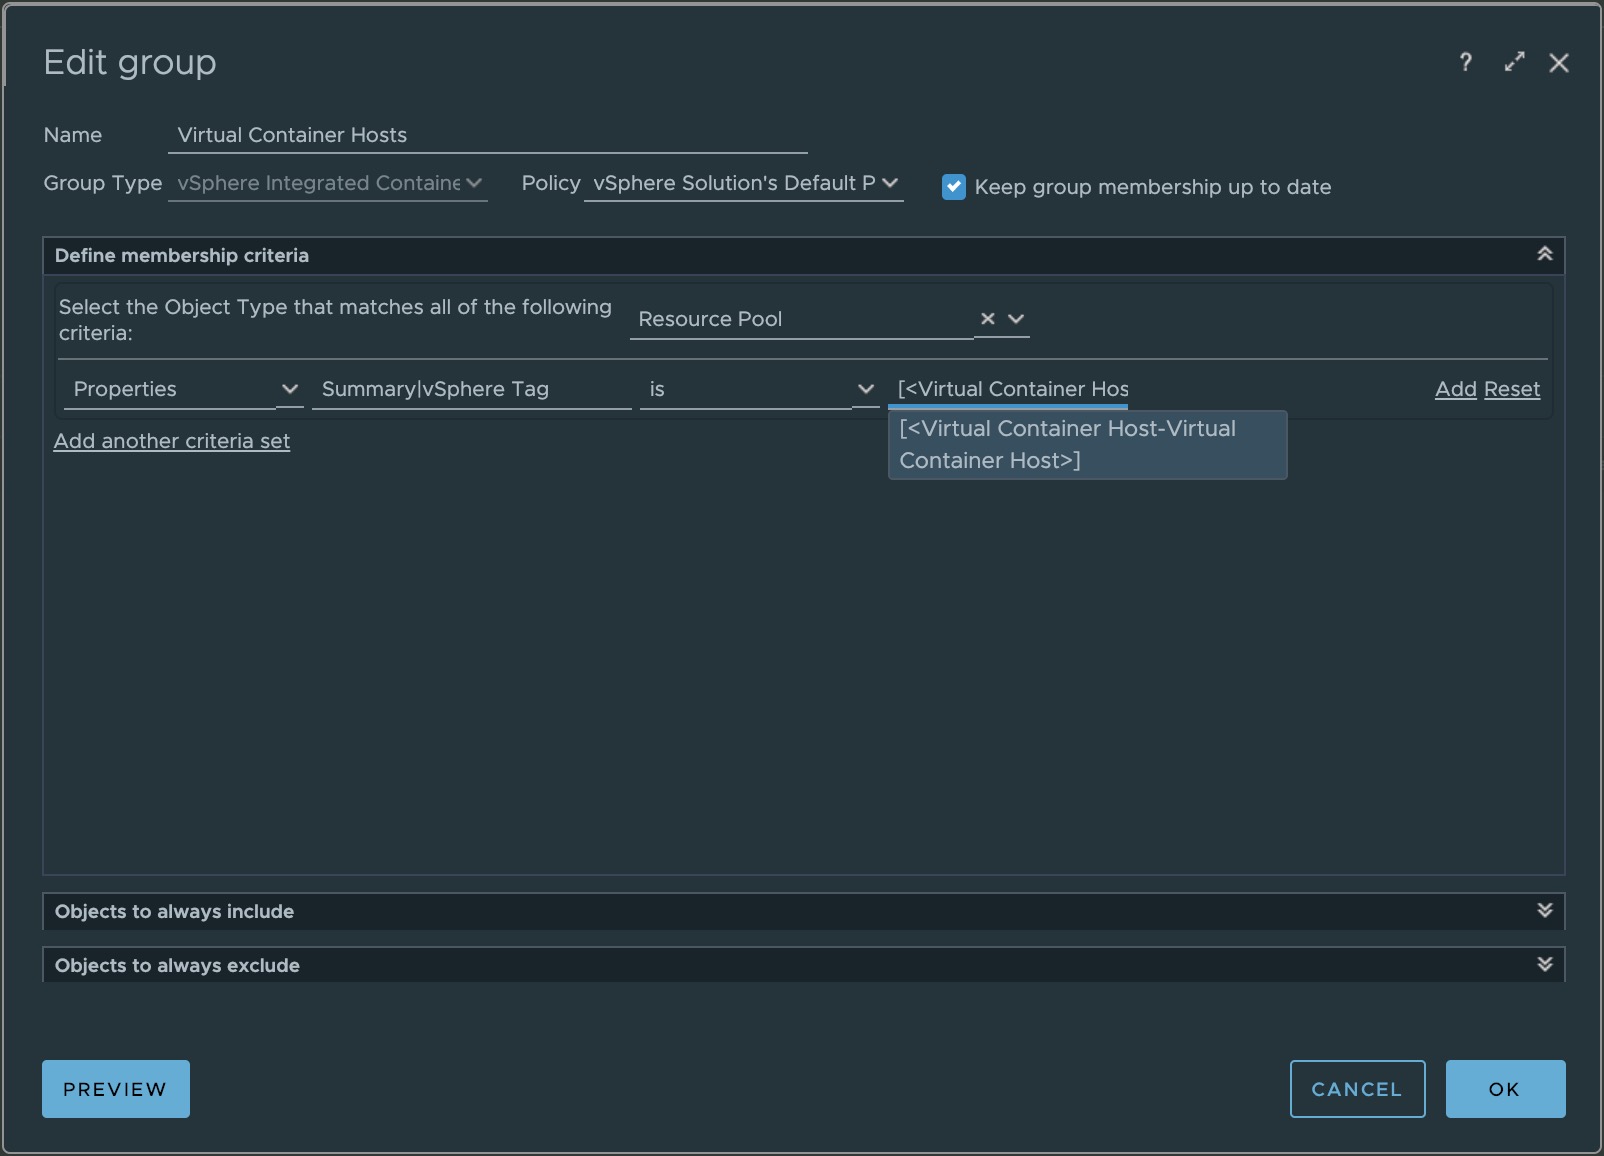
Hit Preview to see if it works.
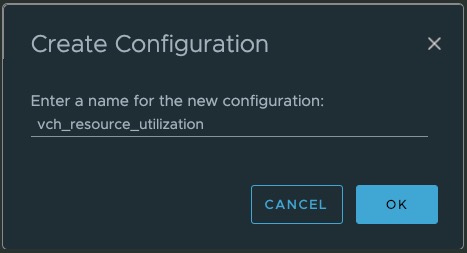
The next step, step #3, is the configuration of a specific metric set which will only show us what we´ll see in our dashboard reagrding the Virtual Container Host Resource Pool as well as the Container-VM. To configure those, go to Administration and Configuration again and select this time Metric Configurations.
Select the folder ReskndMetric and hit the plus sign above to create a new one. I´ve named the first of my two configurations vch_resource_utilization. Of course you can title it as you like but we have to keep in mind that we have to select this one after the dashboard import.
After assigning the name, please copy the following xml code and paste it into your new metric configuration.
|
|
The second metric configuration is specific for the performance of the Container-VM. I´ve named it container_vm_performance.
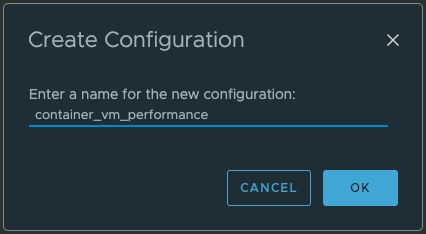
Copy the xml code and again simply paste it into.
|
|
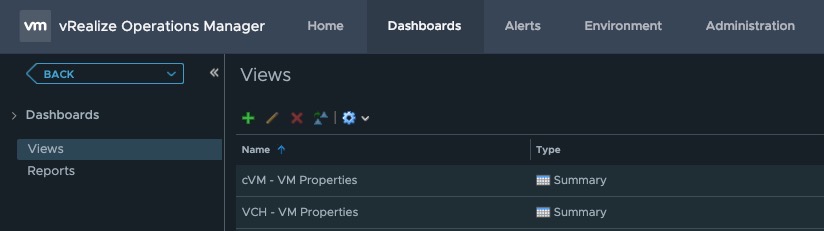
The last point (#4) before we are ready to go is the import of the two custom views. Click Dashboards, and then in the left pane click Views. Click on the gear icon, select Import View and navigate to the folder where you´ve downloaded the files to. To ensure that the dashboard will work smoothly after importing it check if the import of the two custom Views were successfull. Just filter by “vm properties” and your search should result in the following:
Conclusion
vRealize Operations Manager has evolved greatly over time and building custom dashboards according to your own ideas and demands is quite fun. Let´s just take the new Dashboard Canvas which was shipped with version 7.0 as an example. It´s not all about how cool it looks like but rather than the simplicity it brings during the creation of an dashboard.
Here are two posts I would like to recommend to read with regard to:
The #vCommunity is more active than ever on sharing great work and if you like to make use of what the #vCommunity already cooked or even better if you like to share your own creations, please go here: https://vrealize.vmware.com/sample-exchange/ and give it a shout-out on Twitter. Our great Product-Manager´s will hear you 😎.
Super excited to see how the #vROps community has grown over the past few years. I remember the lack of blogs and Ops experts. It is great to see this achievement of community driven ops content. To the #OpsCommunity.. Cheers.. @VMware #vExpert @vRealizeOps @vmwarecloudmgmt https://t.co/AEc6qgZ0Ep
— Sunny Dua (@Sunny_Dua) January 5, 2019
And in case you are already a vR Ops-Ninja and you are not on this list https://twitter.com/johnddias/lists/vrops-friends1 reach out to John Dias and he´ll put your name on the list as well.

Resources
| Article | Link |
|---|---|
| [@VMware Blog] Dashboards Made Easy with vRealize Operations | https://blogs.vmware.com/management/2018/10/dashboards-made-easy-with-vrealize-operations.html |
| [@VMware Blog] Bigger, Stronger, Faster Dashboards using vRealize Operations 7.0 | https://blogs.vmware.com/management/2018/10/bigger-stronger-faster-dashboards-using-vrealize-operations-7-0.html |
| [@VMware Blog] VMware´s Cloud Management Blog | https://blogs.vmware.com/management/ |
| [@VMware Blog] VMware´s Cloud-Native Blog | https://blogs.vmware.com/cloudnative |